Peak season does not just test your network. It exposes what you can and cannot measure.
Once volumes normalize, 3PLs and shippers have a short window to look back with full-season data and answer the questions that matter: where did costs rise, where did service slip, and what problems are likely to repeat next peak.
This article breaks down the core 3PL KPIs and shipping KPIs that support a clear post-peak review. Whether you are managing performance as a 3PL or evaluating partners and carriers as a shipper, these metrics turn peak season results into specific actions.
Why These 3PL and Shipper KPIs Matter After Peak Season
Most teams review peak with a few headline numbers, such as total volume, total spend, and a general sense of whether things “went fine.” That is not enough to improve outcomes.
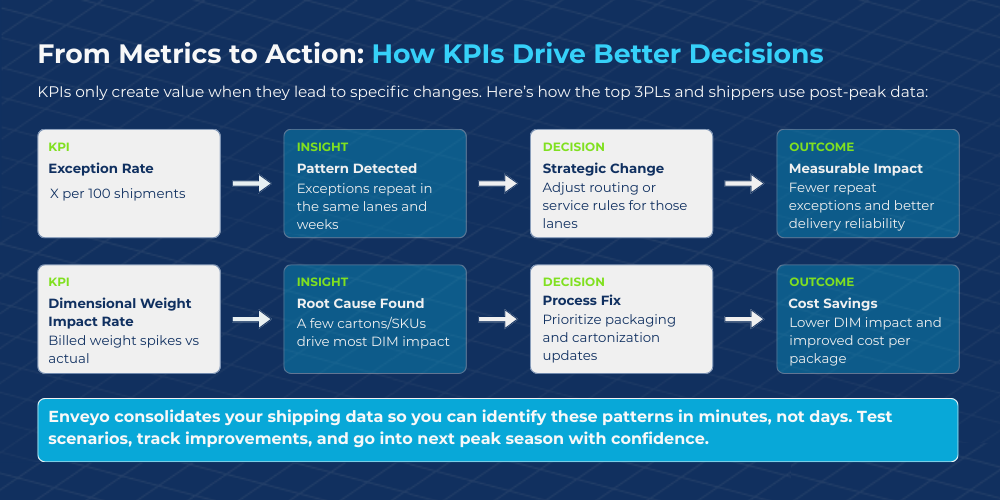
You need KPIs that do three jobs at once:
1. Explain the outcome
2. Reveal the driver
3. Point to a lever
How to Use This List for 3PL and Shipper Evaluation
These KPIs work best when you review them consistently:
- Compare peaks weeks vs. non-peak weeks
- Break down results by carrier, service level, lane, zone, and ship-from location
- Separate cost drivers from service drivers
- Document decisions that follow the data
This is what turns a post-peak review into an actionable plan. If you want examples of what this looks like in practice, here are shipping optimization software success stories.
The 10 Most Important 3PL and Shipper KPIs
1. Forecast Accuracy
What it measures: How closely planned shipping volume matched actual volume, by day and week, and ideally by ship-from location and lane.
Why it matters: Forecast misses do not just create stress. They change the shipping mix, trigger avoidable upgrades, and reshape cost patterns.
How to use it post-peak:
- Compare forecast vs. actual by week and by facility
- Flag weeks with the biggest variance and document what caused them
- Pair variance weeks with cost per package and exception rate to see downstream impact
Quick check: If your biggest forecast miss lines up with a spike in expedited services or accessorial fees, you have a planning-to-cost issue, not just a planning issue.
2. On-Time Delivery Rate
What it measures: The percentage of shipments delivered on or before the committed delivery date.
Why it matters: This is one of the clearest indicators of whether your carrier strategy held up when volume surged. It is also a direct input into client confidence and end-customer trust.
How to use it post-peak:
- Segment by carrier, service level, zone, and ship-from location
- Compare peak weeks vs. baseline weeks to see where performance degraded
- Cross-check lanes with poor on-time performance against service level usage to see if you are paying more without getting better outcomes
Questions you should be able to answer:
- Which carriers performed best under peak load, and in which lanes?
- Where did performance drop significantly, and what was the common denominator of those shipments?
- Did premium services actually improve on-time delivery, or did they only increase spend?
What to do next: Use the worst-performing lane and carrier combinations as your starting point for routing rule changes or contract discussions.
If you’re seeing consistent peak breakdowns in specific lanes, this is where carrier diversification strategies can reduce risk and stabilize service.
3. Exception Rate
What it measures: The percentage of shipments that hit a carrier exception, such as delays, holds, address issues, weather disruptions, damage, or attempted delivery.
Why it matters: Exceptions are where cost and customer friction stack up. They drive service recovery work and hide recurring operational risk.
How to use it post-peak:
- Measure exceptions per 100 shipments overall and by carrier
- Identify top exception types by volume and by cost impact
- Pinpoint repeat exception lanes across multiple weeks
Questions you should be able to answer:
- What exception types drove the most cost and repeat disruptions?
- Where did exceptions repeat (lanes, zones, ship-from locations), week over week?
- Which carriers or services broke down most under peak conditions?
- Which exceptions were preventable with better routing, packaging, or address quality?
Watch out for: Treating “weather” or “carrier delay” as a dead end. Even external disruptions can be reduced with smarter routing, service level rules, and earlier detection.
4. Cost Per Package
What it measures: Your total shipping cost divided by total packages shipped, including base charges and fees.
Why it matters: Total spend doesn’t tell you if your operation got more expensive. Cost per package does. It shows whether peak season scaled efficiently or quietly compressed margin.
How to use it post-peak:
- Compare peak weeks vs. non-peak weeks to see if unit cost climbed under stress
- Break it down by carrier, service level, zone, and lane to find what is driving the increase
- Pair it with Accessorial Fees Rate and Dimensional Weight Impact, so you can separate rate problems from fee and packaging problems
Questions you should be able to answer:
- What percent of peak cost increases came from base rates vs. fees?
- Which lanes or zones drove the biggest unit-cost jump, and why?
- Did service-level upgrades improve outcomes enough to justify the added cost?
Watch out for: Stopping at the blended number. Cost per package is the alert. The “why” is almost always hiding fees, DIM, service levels, or mix shifts.
5. Accessorial Fees Rate
What it measures: How often surcharges and extra fees appear, and how much they contribute to total shipping cost.
Examples include delivery area surcharges, additional handling, oversized charges, residential fees, and address correction fees.
Why it matters: Accessorials often explain why shipping costs rose even when negotiated rates looked fine. They are also one of the most actionable cost categories.
How to use it post-peak:
- Rank accessorials by frequency and by total cost impact
- Identify where fees are concentrated by carrier, lane, and package profile
- Compare peak vs. baseline to see which fees spike under stress
What to check first: Start with the top one to three fee types by total cost impact. That is usually your fastest path to savings.
6. Dimensional Weight Impact Rate
What it measures: How often dimensional weight pricing applies and how much it increases billed weight and cost.
Why it matters: Dimensional pricing can quietly inflate unit cost, especially during peak when carton selection shifts and speed matters more than optimization.
How to use it post-peak:
- Compare billed weight vs. actual weight frequency during peak vs. baseline
- Identify carton types, products, or order profiles that trigger the biggest jumps
- Flag lanes where dimensional impact and accessorial fees stack up
Quick win: If a small number of carton sizes drive most dimensional impact, prioritize packaging rules and cartonization adjustments there first.
7. Time-in-Transit Performance
What it measures: How long shipments actually took in transit, by lane and carrier, and how consistent that performance was.
Why it matters: Averages hide volatility. Predictability is what protects your delivery promises and reduces the need for costly upgrades.
How to use it post-peak:
- Track median transit time and variability, not just the average
- Identify lanes where transit is consistently inconsistent
- Compare carriers on consistency within the same lane
What good looks like: Lower variability is often more valuable than slightly faster averages, especially in peak when promise windows tighten.
8. Promise-Keeping Rate
What it measures: The percentage of orders delivered within the delivery promise communicated to the customer.
Why it matters: On-time delivery is carrier-centric. Promise-keeping is customer-centric. You can deliver “on time” to the carrier commitment and still miss what the customer expected.
How to use it post-peak:
- Measure promise-kept rate by region, carrier, service level, and peak week
- Identify where promise logic was too aggressive under peak conditions
- Cross-check promise misses against service upgrades and time-in-transit variability
Questions you should be able to answer:
- Where did promise misses spike, and what changed that week?
- Are you making promises based on ideal transit times instead of realistic ones?
- Which lanes can sustain tighter promises, and which ones need wider windows?
What to do next: Tighten promises only where the data supports it, and widen them where variability is high. That protects both cost and customer experience.
9. Billing Accuracy and Contract Compliance
What it measures: Whether invoices match negotiated rates and terms, and how often discrepancies occur.
Why it matters: Billing errors and contract noncompliance can quietly accumulate into meaningful spend. Without monitoring, you pay for mistakes you never see.
How to use it post-peak:
- Audit invoice lines against contract terms for a representative period, then scale monitoring
- Track discrepancy types by carrier and fee category
- Quantify dollars at risk and recovery opportunities
Questions to ask in your carrier review:
- What are the most common causes of billing discrepancies this season?
- What is the carrier process for dispute resolution and prevention?
- Are there specific accessorials or lanes that are driving repeated errors?
10. Rate Change Exposure
What it measures: How rate changes, including general rate increases, impacted your specific shipping profile across zones, service levels, and package characteristics.
Why it matters: Rate changes do not hit every shipper or 3PL the same way. If your mix shifted during peak, your cost exposure likely shifted too.
How to use it post-peak:
- Compare year-over-year peak cost by zone and service level
- Identify which segments saw the biggest lift
- Use scenario modeling to understand what would have changed under different routing or service rules
Quick check: If most of your rate exposure sits in a small set of zones or services, focus negotiations and routing strategy there first.
KPIs for Shippers vs. KPIs for 3PL Evaluation
There is overlap between KPIs for shippers and KPIs for 3PL evaluation, because the same shipment data drives both.
The difference is the decision you make:
- Shippers use KPIs to manage total landed cost and customer experience across carriers and fulfillment partners.
- 3PLs use KPIs to prove reliability, protect profitability, and identify operational and carrier strategy changes.
Same metrics. Different accountability.
Quick KPI Scorecard
If you need a fast post-peak snapshot, start here. These are the KPIs you should be able to pull quickly and explain confidently.
- Forecast Accuracy: Where were we off, and what did it trigger?
- On-Time Delivery Rate: Who performed, and where did it break?
- Exception Rate: What failed, and what repeats?
- Cost Per Package: Did the unit cost climb, and why?
- Accessorial Charges Rate: Which fees grew and where?
- Dimensional Weight Impact Rate: Where did packaging inflate costs?
- Time-in-Transit Performance: Where is performance inconsistent?
- Promise-Keeping Rate: Did customers get what we promised?
- Billing Accuracy and Contract Compliance: Did we pay what we negotiated?
- Rate Change Exposure: What changed our cost baseline?
Where Enveyo Fits
You can measure these KPIs manually, but it gets slow quickly when data is split across invoices, carrier systems, contract documents, and exception reports.
Shipping intelligence platforms like Enveyo help by centralizing parcel cost and performance signals so teams can move from reporting to decisions:
- Consolidate cost and performance into one view
- Track accessorial fees and exception patterns at scale
- Monitor billing accuracy and contract compliance continuously
- Model “what-if” scenarios so you can quantify routing and contract decisions
If your post-peak review ends with “we think,” you are leaving money and leverage on the table. If it ends with “we know,” you can negotiate, adjust strategy, and go into the next peak with more control.